5.2 Decision Trees
A decision tree is another classifier we can try out. Can it beat logistic regression?
from sklearn import tree

dec_tree = tree.DecisionTreeClassifier(max_depth=4)
dec_tree.fit(X_train, y_train)

# Check its accuracy
## DecisionTreeClassifier(class_weight=None, criterion='gini', max_depth=4,
## max_features=None, max_leaf_nodes=None,
## min_impurity_decrease=0.0, min_impurity_split=None,
## min_samples_leaf=1, min_samples_split=2,
## min_weight_fraction_leaf=0.0, presort=False,
## random_state=None, splitter='best')## 0.7783641160949868y_true = y_test
y_pred = dec_tree.predict(X_test)
matrix = confusion_matrix(y_true, y_pred)
label_names = pd.Series(['unsuccessful', 'successful'])
pd.DataFrame(matrix,
columns='Predicted ' + label_names,
index='Is ' + label_names)| Predicted unsuccessful | Predicted successful | |
|---|---|---|
| Is unsuccessful | 1387 | 180 |
| Is successful | 324 | 383 |
The decision tree performs similarly to the logistic regression, but it has one big big benefit: to explain it, we can draw a super-fun diagram.
import pydotplus
# from IPython.display import Image

dot_data = tree.export_graphviz(dec_tree,
    max_depth=3,
    feature_names=X.columns,
    class_names=dec_tree.classes_.astype(str),
    out_file=None, filled=True, rounded=True,  proportion=True)
graph = pydotplus.graph_from_dot_data(dot_data)
# Image(graph.write_png("output.png"))
graph.write_png("output.png")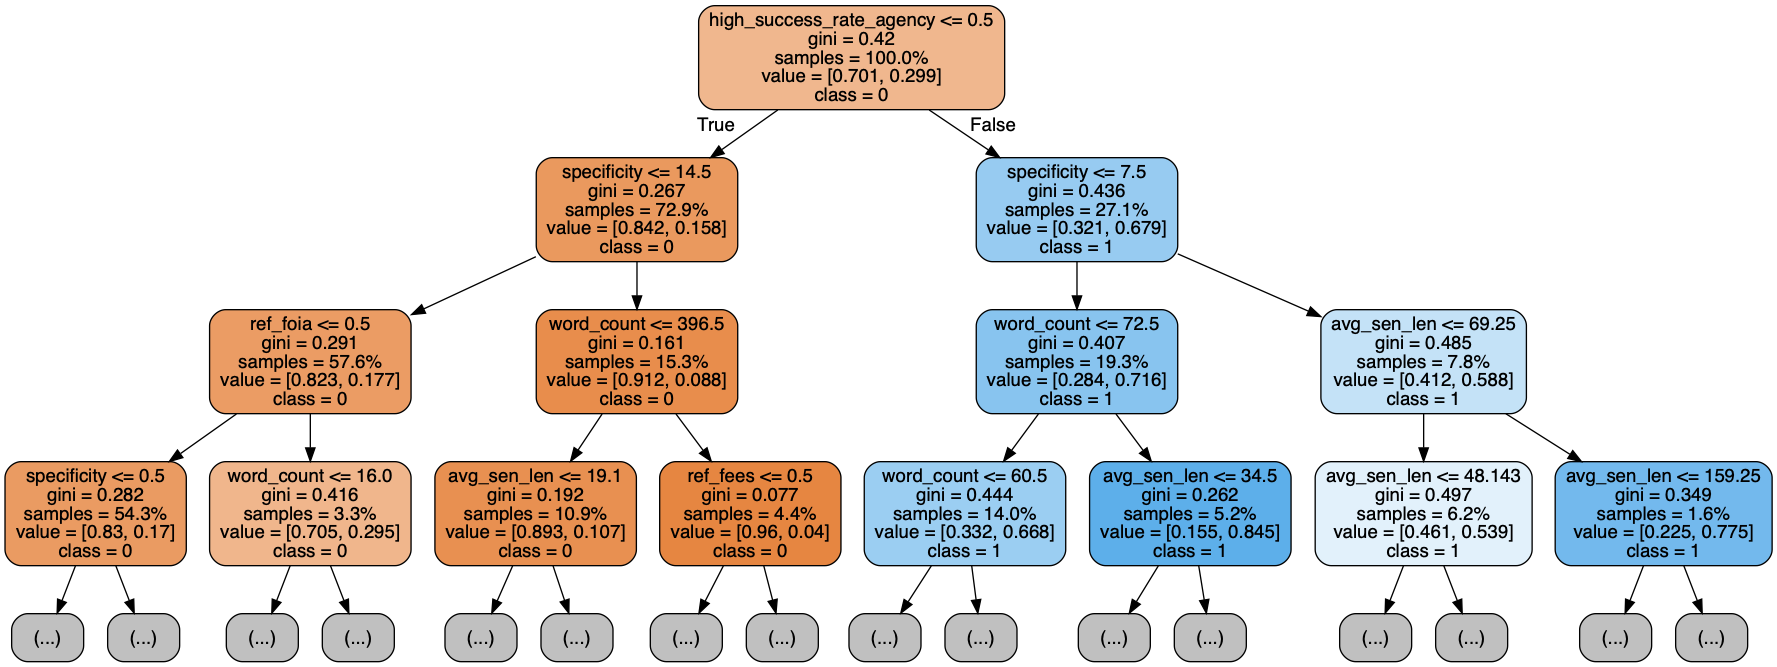
I can also get a similar chart to the logistic regression one, explaining why a particular feature may or may not be important.
| feature | weight |
|---|---|
| high_success_rate_agency | 0.8791873 |
| word_count | 0.0418041 |
| specificity | 0.0376105 |
| avg_sen_len | 0.0324807 |
| ref_foia | 0.0080910 |
| ref_fees | 0.0008264 |
| email_address | 0.0000000 |
| hyperlink | 0.0000000 |
Again, it’s the high_success_rate_agency feature that does heavy lifting.